DATA ANALYSIS / COIT29225
Brisbane House Price Analysis
Turning a small Brisbane housing dataset into understandable statistics, categories and reproducible charts.
Exploratory data analysis and reporting across five suburbs, using Python to derive descriptive statistics and export chart-backed findings.
- Python
- pandas
- NumPy
- Matplotlib
- EDA
- Property records
- 110
- Brisbane suburbs
- 5
- Exported data visualisations
- 4
01 / PROJECT EVIDENCE
Actual results, not mock-ups.
These figures are copied directly from the public GitHub repository and are presented with context.
02 / PROBLEM
The engineering question.
A supplied table of house prices is difficult to interpret without validation, distribution summaries and consistent visual comparisons between suburbs and demand categories.
03 / METHOD
What I built and evaluated.
- Validated the CSV's price, suburb, demand and identifier columns; checked missing entries and duplicate records.
- Calculated the median, low/high values, quantiles, mean, standard deviation, skewness and above-median proportions in Python.
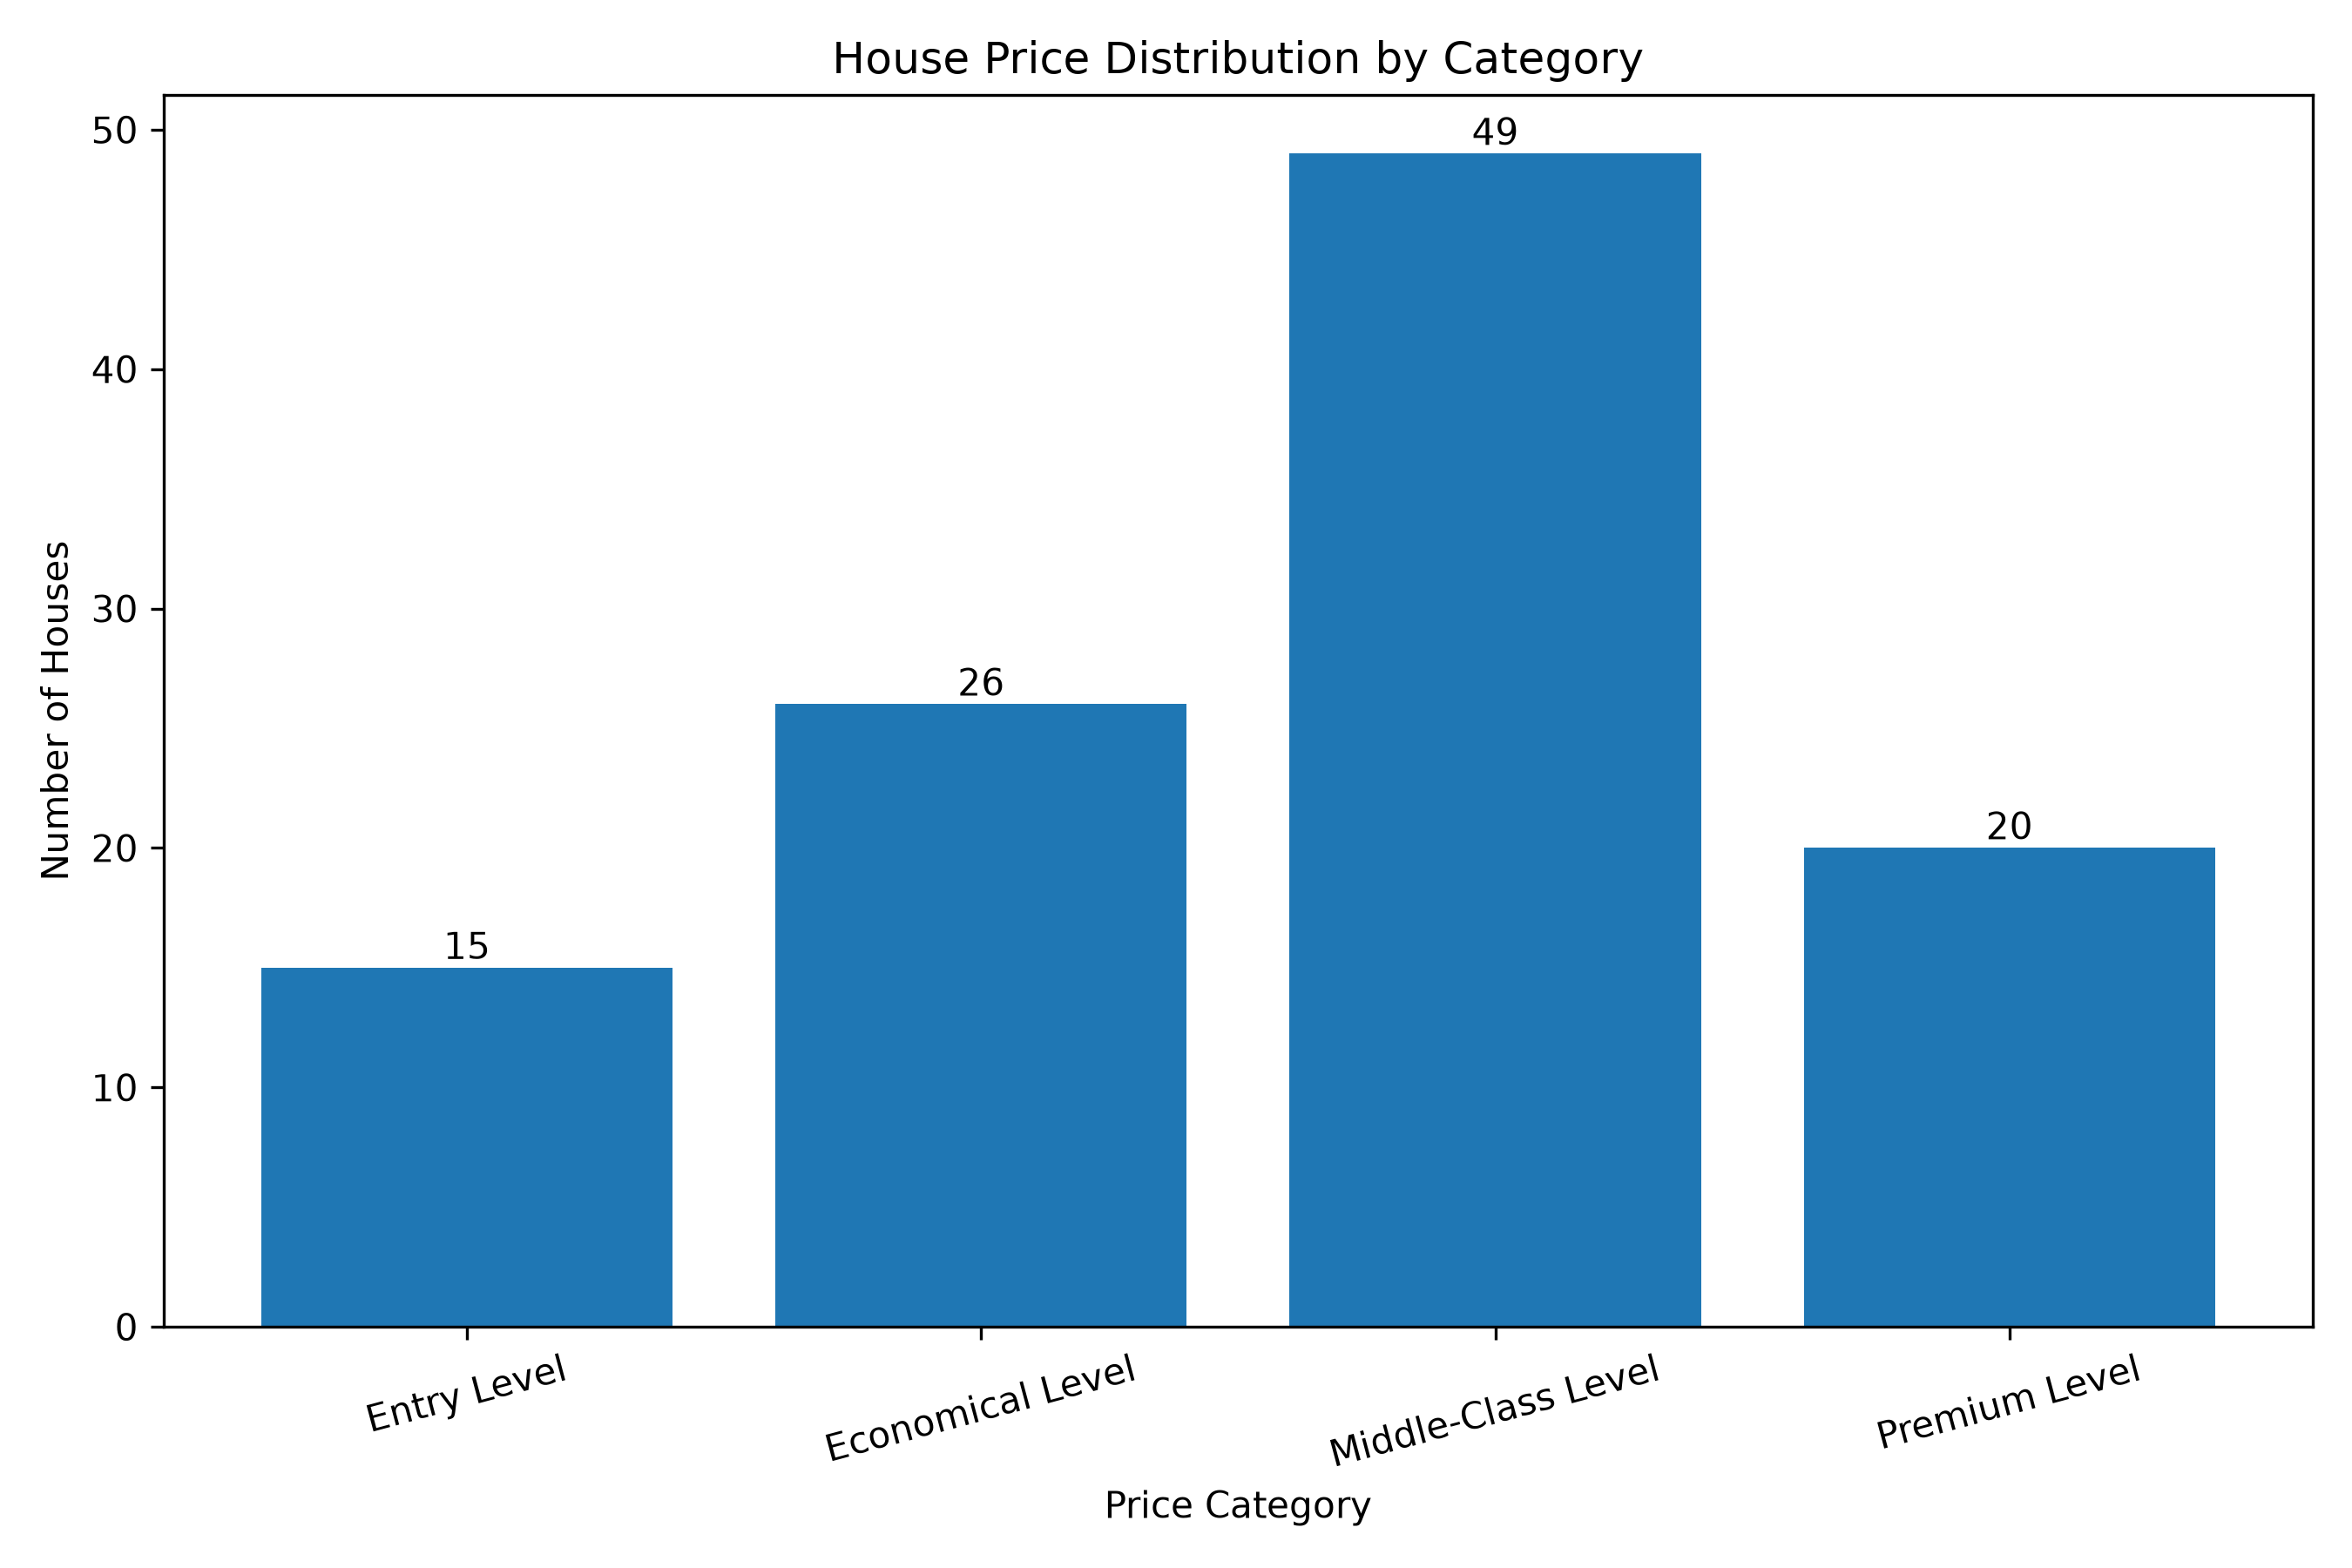
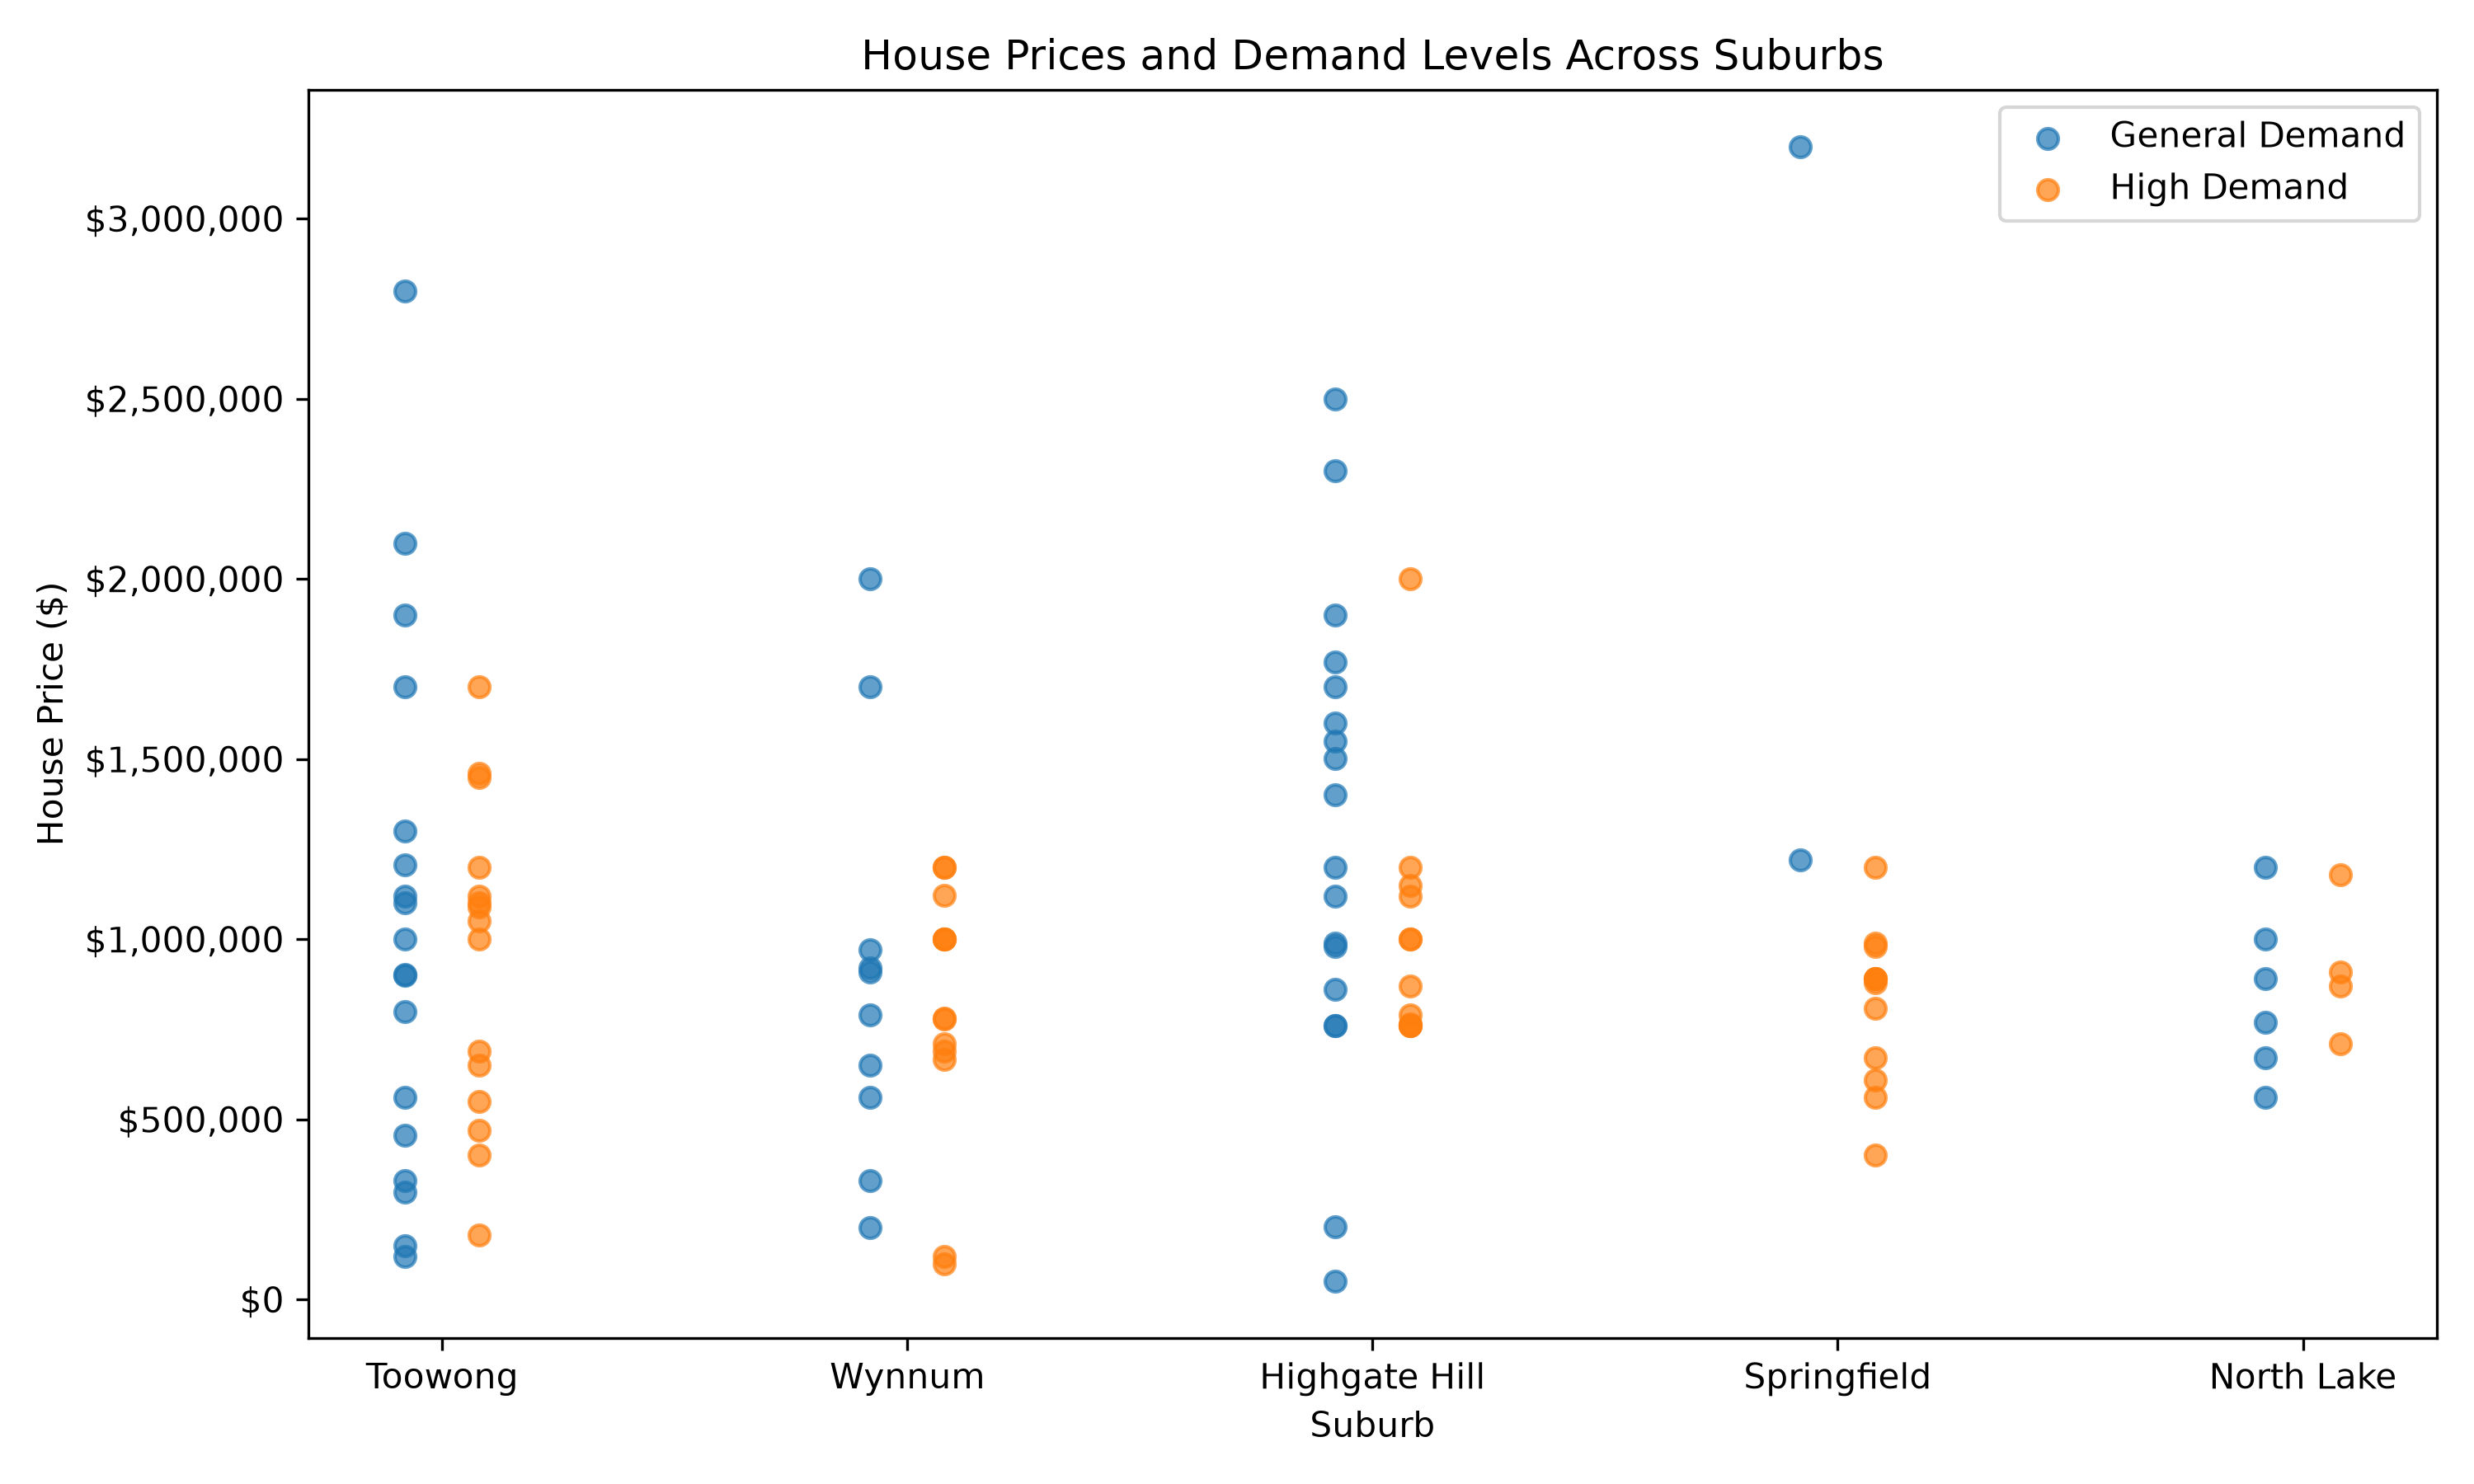
- Grouped prices into entry, economical, middle-class and premium ranges; compared high and general demand categories and suburb distribution.
- Generated and saved charts, an ascending price-sorted CSV and a technical PDF report from the same source calculations.
04 / MEASURED FINDINGS
What the evidence shows.
- The project generates a price-category bar chart and pie chart alongside demand-price and suburb-demand comparisons.
- All 110 rows remain in the sorted CSV, with calculated median, minimum and maximum metadata added.
- This is statistical exploration and reporting; no forecasting or predictive neural network is claimed for this Assignment 1 part.
05 / LIMITATIONS
Where the claims stop.
The dataset contains only 110 supplied records and five suburbs; it should not be interpreted as a representative or current picture of Brisbane housing prices.
PROJECT SOURCE
Inspect the implementation.
See the original code, data-handling choices, documented experiments and repository instructions.